About this app
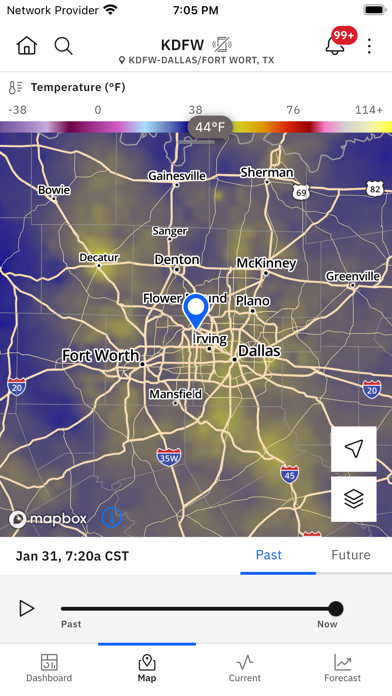
Designed for businesses looking to increase operational efficiency and improve safety for their workforce. Weather impacts all sectors of the economy globally. However, most businesses don't have the luxury of hiring a meteorologist. IBM Dashboard Visualization will become that meteorologist on your staff. Watching the weather that matters to your business, and notifying you when changes are happening, or even expected to happen. If you need to make the right call when it matters, IBM Dashboard Visualization is an essential tool for your business.
Latest release
What’s New
• Security fixes
Audience growth
Ratings growth
Baseline captured. Growth appears after the crawler observes a changed rating count.
Momentum comes from crawler snapshots for the tracked storefront. “Viral growth signal” means unusually fast recent rating gains; it is an indicator, not download data.
Price tracking
Price intelligence
First snapshot captured. The trend line starts after the next crawler price observation.
- First observed Sep 25, 2026 · 11:17 AM Free
Screenshots