About this app
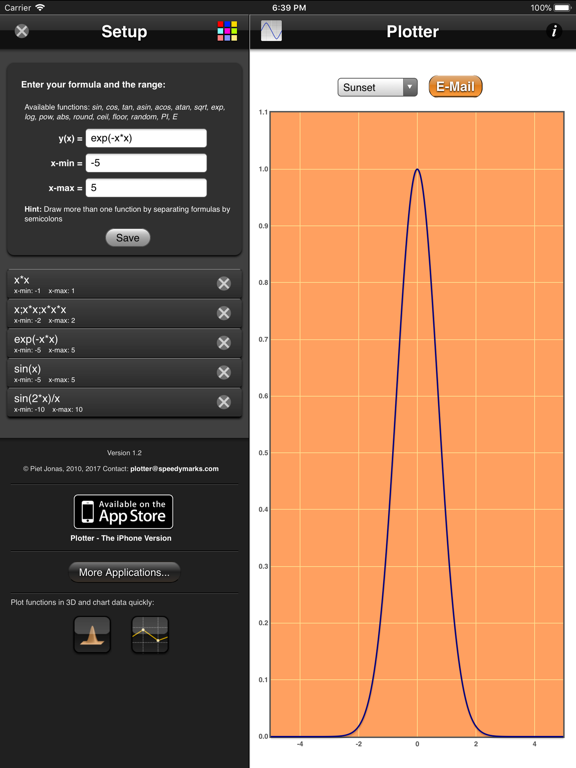
Plot graphs of functions. Enter your formula and the range you want to plot. Features: - By separating the formulas with semicolons you can draw more than one function. - Tap the chart to flip through the themes. - Save formulas for later use. - E-Mail the formulas, charts and let others open them in the plotter web application. - retina display support
Latest release
What’s New
- bug fix
Audience growth
Ratings growth
Baseline captured. Growth appears after the crawler observes a changed rating count.
Momentum comes from crawler snapshots for the tracked storefront. “Viral growth signal” means unusually fast recent rating gains; it is an indicator, not download data.
Price tracking
Price intelligence
First snapshot captured. The trend line starts after the next crawler price observation.
- First observed Sep 3, 2026 · 10:14 AM $1.99
Screenshots