About this app
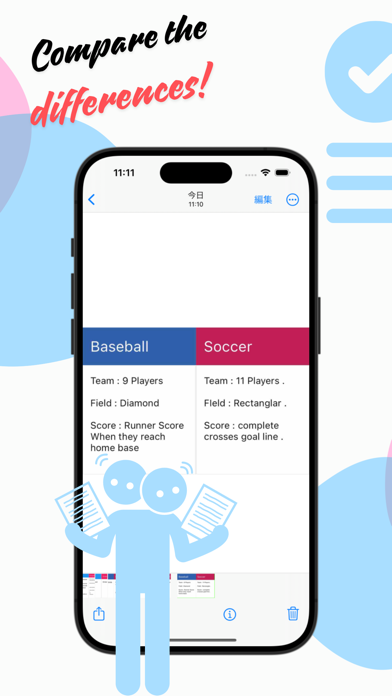
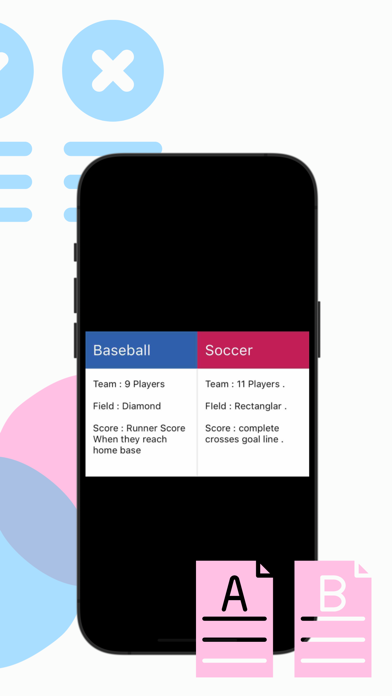
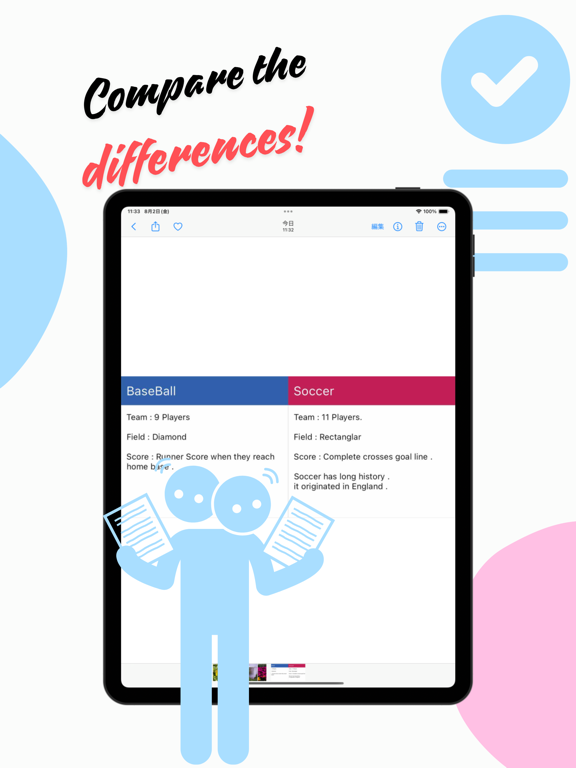
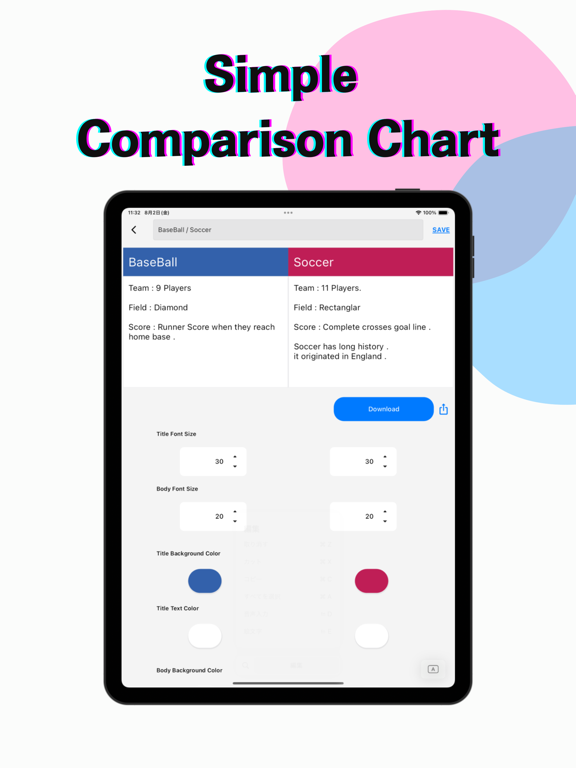
Simple Comparison Chart Creation Application - Compare It You can compare the differences by this app. ■ Description "Compare It" is a simple comparison chart making application that anyone can use. It organizes useful information for daily life and business situations in an easy-to-understand manner and allows for quick comparisons. ■Features. Easy to use : The intuitive interface allows even beginners to quickly master the application. Customizable : You can freely adjust the title font size, body font size, background color, and text color. Instant download : You can download and share your completed comparison chart with a single tap. Versatile : Compare products, sports rules, travel plans, etc. The possibilities are endless. ■How to use 1. enter the items you want to compare (e.g., baseball and soccer). Customize font size and colors as needed. Download, save, and share your completed comparison chart. With CompareIt! you can organize even complex information in an easy-to-understand manner. Whether you're making small, everyday comparisons or important business decisions, CompareIt! Download it now and become an information organizer! ■Use Cases 1. sports rule comparison Easily compare the number of teams, field shape, and scoring system of baseball and soccer. 2. product comparison Easily compare smartphone prices, screen sizes, and battery life to select the best model. 3. travel plan comparison Easily compare costs, attractions, and activities of multiple destinations to determine the best travel options. 4. create educational materials Easily compare the characteristics of different eras and cultures to create easy-to-understand educational materials. With this app, you can easily create comparison charts and visually organize information for effective comparison and decision making. ■What the comparison chart does better than the graph 1. provision of detailed information Comparison tables can provide information that includes text and detailed descriptions as well as numerical values. 2. organization of complex information Comparison tables are ideal for comparing multiple elements at once. It organizes different categories and elements so that they can be understood at a glance. 3. intuitive understanding Comparison charts visually organize information and make it easier to understand. It is especially useful when including textual or qualitative information. 4. batch comparison of multiple elements Comparison charts are useful for making complex decisions because they allow you to compare many elements at once. ■ Areas where it is superior to bar and line charts. Bar and line charts are excellent for visualizing numerical data, but they are not suited to presenting detailed textual information or qualitative differences. Comparison charts, on the other hand, allow for more comprehensive comparisons by including text and detailed descriptions as well as numerical values. Comparison tables provide comprehensive qualitative and quantitative information and are especially good for comparing complex elements or when detailed explanations are needed. While bar and line charts excel at visualizing numerical values, comparison tables excel at providing detailed information and complex comparisons.
Latest release
What’s New
Fixed bug
Audience growth
Ratings growth
Baseline captured. Growth appears after the crawler observes a changed rating count.
Momentum comes from crawler snapshots for the tracked storefront. “Viral growth signal” means unusually fast recent rating gains; it is an indicator, not download data.
Price tracking
Price intelligence
First snapshot captured. The trend line starts after the next crawler price observation.
- First observed Aug 20, 2026 · 3:32 PM Free
Screenshots