About this app
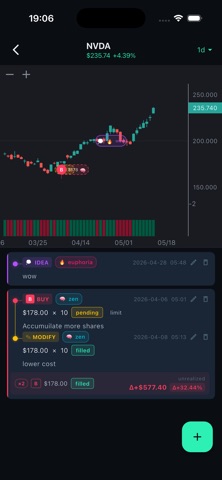
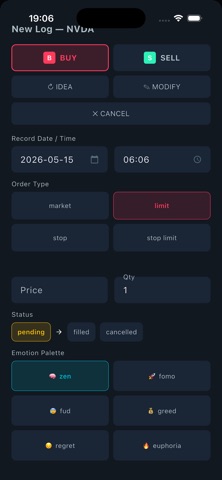
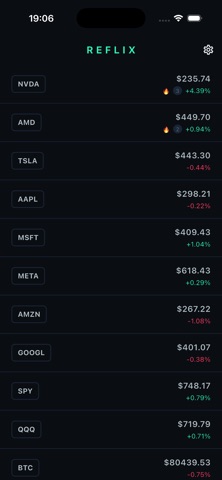
Reflix is a trading journal built for serious traders who want to understand not just what they traded — but why. Log every buy, sell, modify, or cancel order directly against a candlestick chart. See your entries as markers on the price history, track your emotional state at the time of each decision, and review your full trade timeline in one place. KEY FEATURES • Candlestick charts — view price history across 15m, 1h, 4h, 1d, and 1wk intervals with your trades plotted directly on the chart. • Trade timeline — a threaded log that groups related orders together. See your original BUY, any MODIFYs, and the final SELL in one clean thread. • Emotion tracking — tag each entry with how you were feeling: zen, FOMO, FUD, greed, regret, or euphoria. Spot the patterns between your mindset and your results. • P&L calculation — unrealised and realised profit/loss calculated automatically from your logged entries and current price. • Parent order linking — link SELL, MODIFY, and CANCEL entries back to the original order for a complete picture of each trade lifecycle. • Watchlist — track multiple tickers with live prices, recent emotion, and log count at a glance. • Dark terminal UI — designed for focused, distraction-free journaling. WHY JOURNAL YOUR TRADES? Most traders lose money not because they lack knowledge, but because they repeat the same emotional mistakes. Reflix gives you a structured record of every decision so you can review, learn, and improve over time. Your journal is private and stored securely on your account. No ads. No data sharing.
Latest release
What’s New
Expected & Estimated Dividends Your portfolio summary now shows a "Next Dividend" row and a year-end projection next to your total. If a confirmed payment date isn't available yet, we estimate it and mark it with "~" so you always know what's confirmed vs. projected. Faster Path to Your Portfolio New accounts now land on Import instead of an empty Watchlist, so getting your CSV or screenshot in — and unlocking News, Advice, and Retro — takes one less step.
Audience growth
Ratings growth
Baseline captured. Growth appears after the crawler observes a changed rating count.
Momentum comes from crawler snapshots for the tracked storefront. “Viral growth signal” means unusually fast recent rating gains; it is an indicator, not download data.
Price tracking
Price intelligence
First snapshot captured. The trend line starts after the next crawler price observation.
- First observed Sep 16, 2026 · 1:49 AM Free
Screenshots