About this app
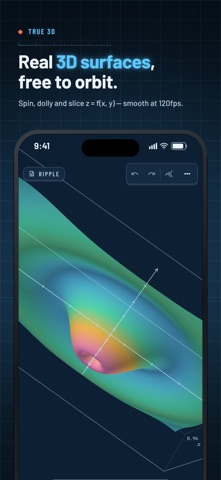
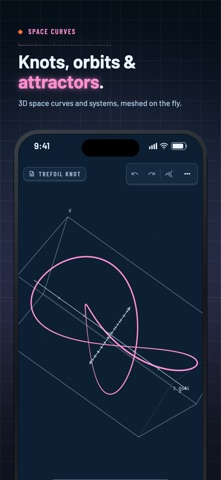
Plott is a fast, native graphing calculator for 2D and 3D — a desktop-class grapher rebuilt for touch. Plot a function, a family of curves, a polar rose or a glowing 3D surface, then pan, zoom and orbit at a silky 120fps. Everything works offline, with no account and no sign-in. Type one line and Plott works out the rest — explicit y = f(x), polar, parametric, implicit, inequalities and vectors, all classified as you type. — GRAPH ANYTHING — • Functions, piecewise, polar, parametric and complex curves • Implicit equations and shaded inequalities • Families: sweep a whole set of curves from a single line • Data tables, scatter points and best-fit regression • 3D surfaces z = f(x, y), parametric surfaces, space curves and knots • Vector fields, slope fields, differential equations and attractors • Contour lines and level-curve heat maps — MATH, BUILT IN — • Sliders: drag a parameter and watch every curve update live • Calculus: derivatives, tangents, integrals and area under a curve • Evaluate limits, sums, products, matrices and determinants • Points of interest: tap to snap to roots, intercepts, extrema and intersections • Trace any curve for a live coordinate readout — TRUE 3D — • Real surfaces you can orbit to any angle — free rotation, no gimbal lock • Pinch to zoom, drag to pan, tap to read a point in space • Isometric, top and front view presets • Smooth at 60/120fps and fully offline — MADE FOR PHONE & TABLET — • A calm, high-contrast drafting studio in two themes: a luminous blueprint dark and a warm vellum light • On tablet, a desktop-class side rail edits every object at once • A purpose-built math keyboard with templates for every curve type • Apple Pencil and hardware-keyboard friendly — YOURS, ALWAYS — • Unlimited undo/redo, autosave and session restore • Export to PNG or PDF, or share a sheet as a file • A gallery of first-party examples to learn from Plott is made for students, teachers, engineers and the mathematically curious — precalculus and calculus, algebra and geometry, statistics and beyond. Replace a clunky handheld and a pile of apps with one beautiful grapher. Graph beautifully. Download Plott.
Audience growth
Ratings growth
Baseline captured. Growth appears after the crawler observes a changed rating count.
Momentum comes from crawler snapshots for the tracked storefront. “Viral growth signal” means unusually fast recent rating gains; it is an indicator, not download data.
Price tracking
Price intelligence
First snapshot captured. The trend line starts after the next crawler price observation.
- First observed Sep 23, 2026 · 5:27 PM Free
Screenshots