About this app
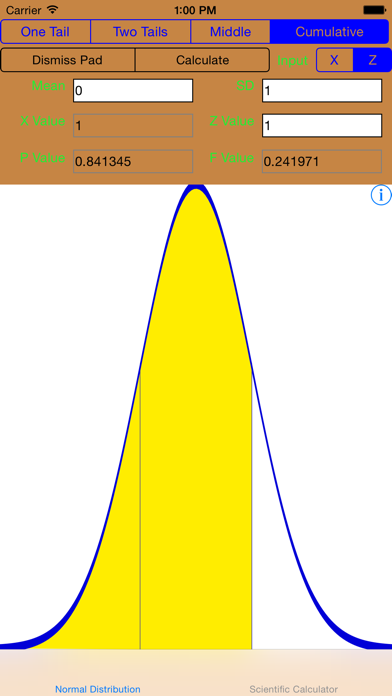
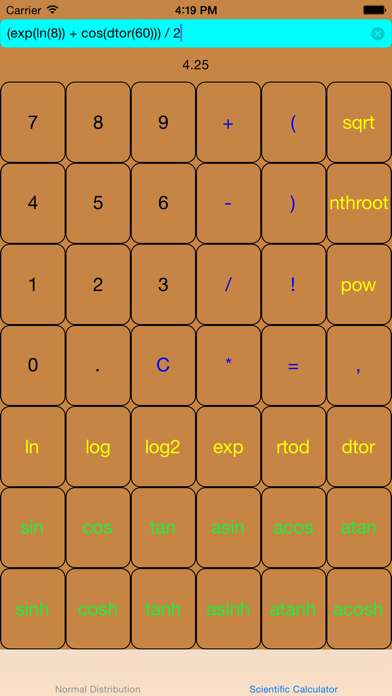
F-Graph calculates and plots the standard normal distribution frequency and density functions. One tail, middle, two tail and cumulative density functions (probabilities) can be calculated together with the raw frequency function. You may enter directly Z values referred to N(0,1), or X values referred to a generic N(m, s). In case of X values, the values for m=mean and s=standard deviation are also required. If Z values are entered, X values are computed according to m and s and the other way around. F-Graph also works as a scientific calculator. You may enter the calculation clicking on the buttons of the application pad or directly directly enter the expression as text. Press = to perform the calculation. The calculator supports multiple level of parentheses. A parenthesis is automatically appended when a function button is pressed. You will have then to enter the argument and the closing brace. Supported functions: ln(X) logarithm base e log(X) logarithm base 10 log2 logarithm base 2 exp(X) e to X rtod radians to decimal degrees dtor decimal dgress to radians sqrt(X) square root of X nthroot(X, N) Nth root of X pow(N, X) N to X all common trigonometric functions. Arguments are entered and returned in radians
Latest release
What’s New
This update from Apple will improve the functionality of this app. No new features are included. Improved UI Added general purpose scientific calculator Support of iOS 8
Audience growth
Ratings growth
Baseline captured. Growth appears after the crawler observes a changed rating count.
Momentum comes from crawler snapshots for the tracked storefront. “Viral growth signal” means unusually fast recent rating gains; it is an indicator, not download data.
Price tracking
Price intelligence
First snapshot captured. The trend line starts after the next crawler price observation.
- First observed Aug 23, 2026 · 2:42 AM Free
Screenshots