About this app
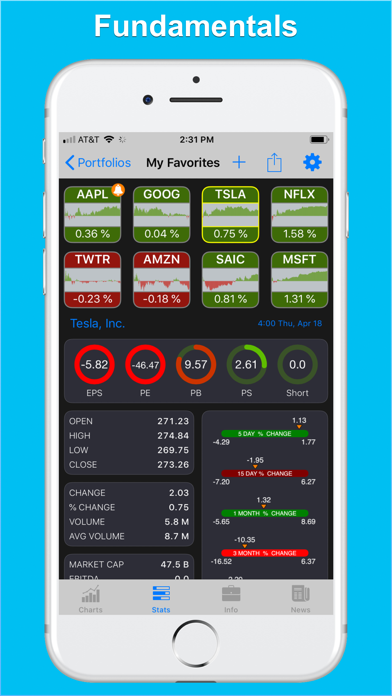
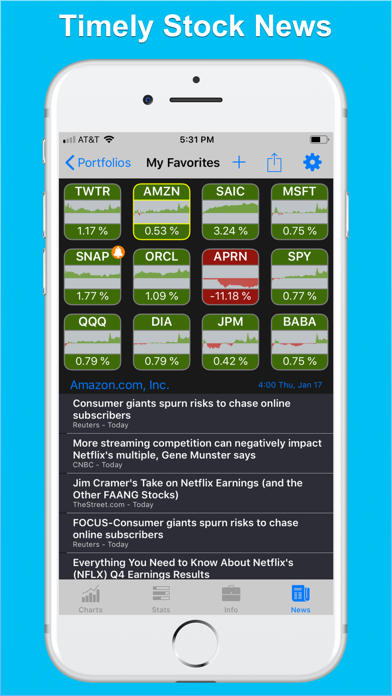
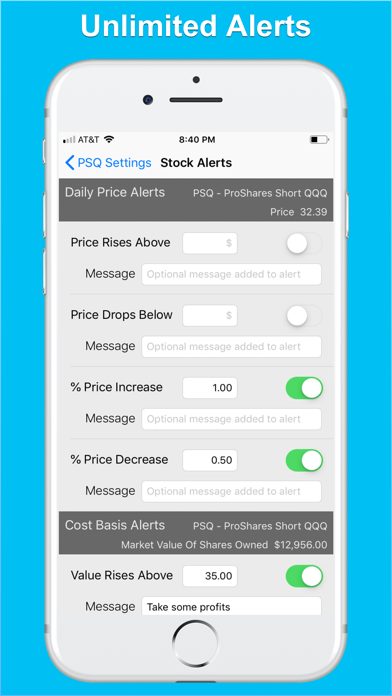
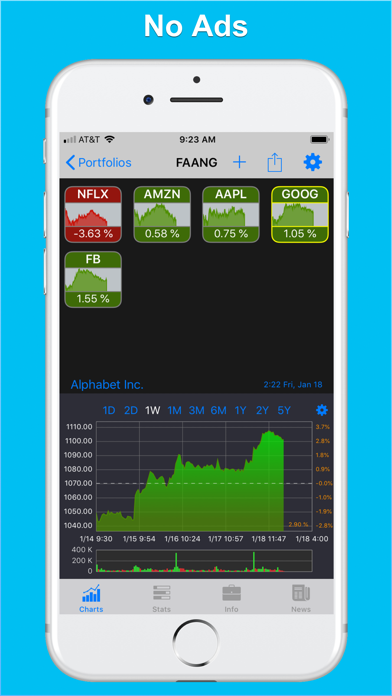
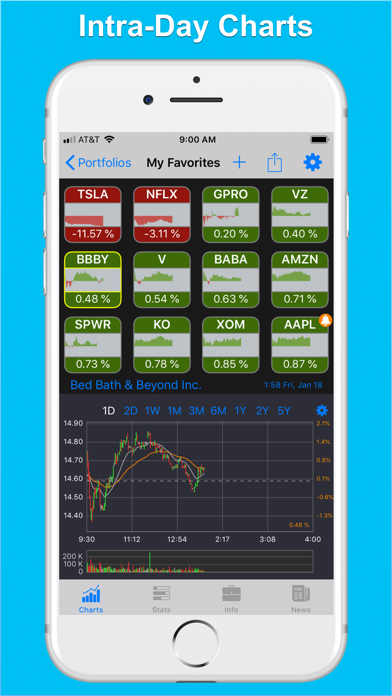
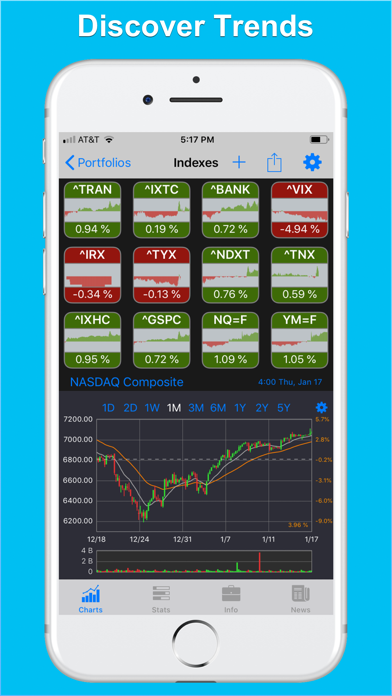
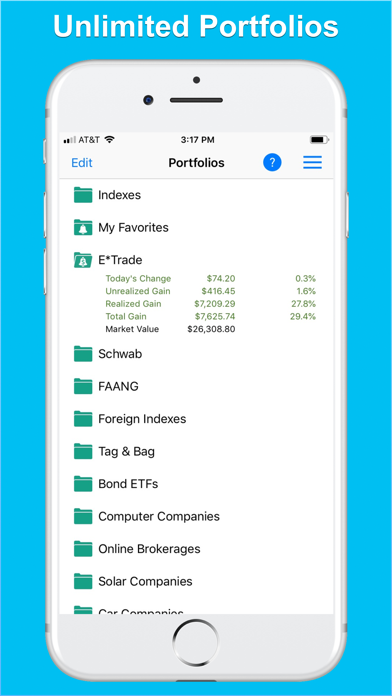
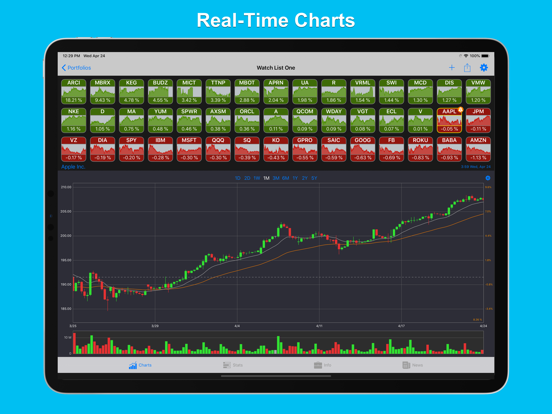
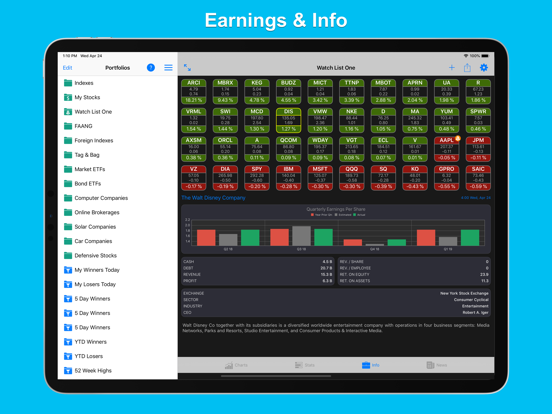
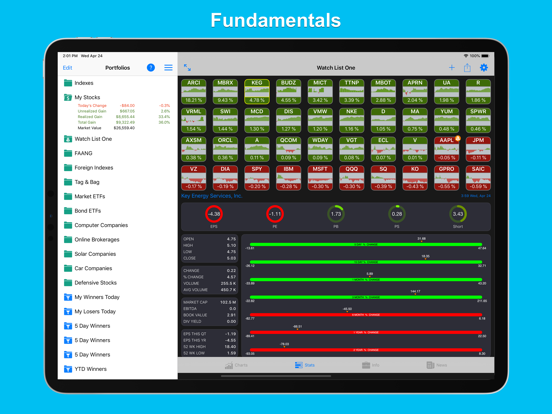
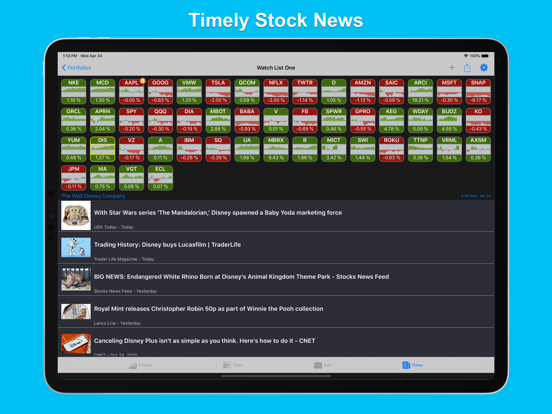
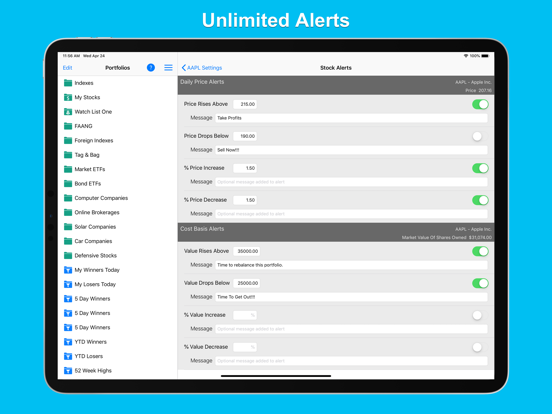
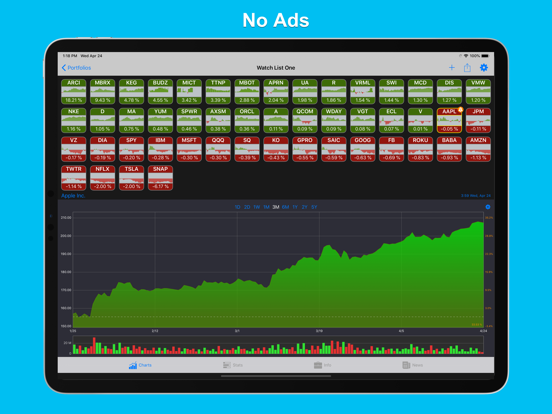
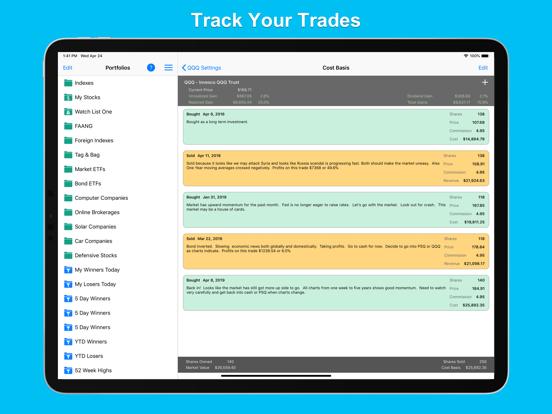
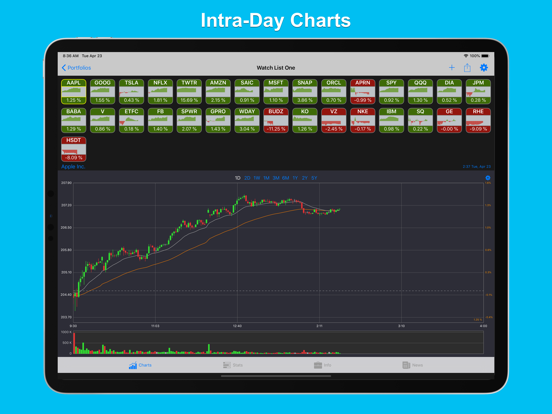
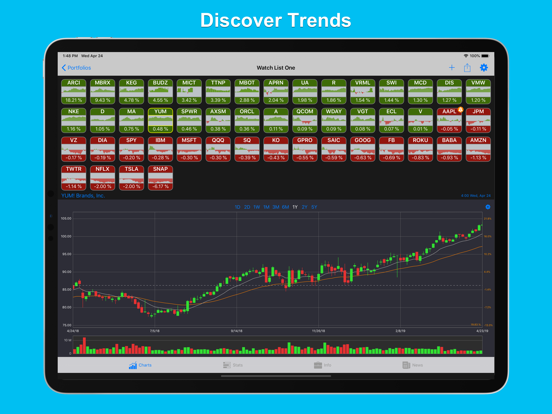
StockHop is a fully customizable, real-time stock tracker built around a breakthrough tile display that lets you spot trends across hundreds of stocks at a glance. Compare multiple fundamental values across your entire portfolio at once, using clean, color-coded graphics that make dense data easy to read at a glance. Never miss a move. Set custom price and percent-change alerts, and attach your own notes so you remember exactly why you set each one — "cash out," "buy more," whatever fits your plan. Your data stays in sync across your devices. Make a change on your iPhone and it shows up on your iPad automatically. Now redesigned with Apple's Liquid Glass, StockHop looks and feels right at home on the latest iPhone and iPad — with performance and reliability improvements throughout. FEATURES • Real-time quotes and charts. • Scrollable mini-tile displays that can show an area chart, a trend chart, or a text view. • Tap any stock tile to instantly update the details in every other display. Hop from stock to stock to compare values. • Create as many portfolios as you want, then rename, reorder, and delete them anytime. • Dynamic Portfolios that StockHop builds and maintains for you, adding stocks based on preset criteria. • Price and percent-change alerts with custom notes, delivered the moment a stock crosses a threshold you set. • Cost Basis view to record your buy and sell trades, with realized and unrealized gains and losses shown for each position. • Real-time news feed to help you connect stock moves with market trends and world events. • Multiple chart styles — candlestick, area, and line — with optional fast and slow exponential moving average lines. • Intraday and multi-day chart ranges: 1 Day, 2 Days, 1 Week, 1 Month, 3 Months, 6 Months, 1 Year, and 2 Years. • Rotate your iPhone or iPad for a full-screen view of the chart, stats, or news panels. • Pinch-to-zoom charts both vertically and horizontally for greater detail. • Area and line charts change color automatically — green for a gain, red for a loss. • Key fundamentals — EPS, PE, PB, PS, and Short Ratio — presented as color-coded circle charts you can read in a glance. • A complete set of performance stats: Open, High, Low, Close, Change, Percent Change, Volume, Avg. Volume, Market Cap, EBITDA, Book Value, Dividend Yield, and Earnings Per Share for this quarter, next quarter, this year, and next year. • Price percent-change range bars for 5 Days, 15 Days, 1 Month, 3 Months, 6 Months, 1 Year, and 2 Years, to compare volatility across stocks. StockHop is a tracking and research tool. It does not provide investment advice or recommendations. SUBSCRIPTIONS — StockHop All Access • Payment will be charged to your Apple Account at confirmation of purchase. • Your subscription renews automatically unless auto-renew is turned off at least 24 hours before the end of the current period. • The subscription period is monthly or annual, depending on the plan you choose. • Your account will be charged for renewal within 24 hours before the end of the current period, at the price shown. • You can manage your subscription and turn off auto-renewal at any time in your Account Settings after purchase. • Any unused portion of a free trial period, if offered, is forfeited when you purchase a subscription. CONTACT US We love hearing from our users. Reach us anytime with questions or suggestions using the "Contact Us" button in the app. PRIVACY POLICY https://www.digitalbeachsoftware.com/Privacy.html TERMS OF USE https://www.digitalbeachsoftware.com/TermsOfUse.html ACKNOWLEDGEMENTS Some icons were provided by Icons 8 — icons8.com
Latest release
What’s New
StockHop is back with a fresh coat of paint and a tune-up under the hood: • Redesigned with Apple's Liquid Glass for a cleaner, more modern look across iPhone and iPad. • Numerous under-the-hood improvements to performance, stability, and reliability. This is the first step of a bigger refresh — more to come. Thanks for tracking with us, and please reach out through the in-app Contact Us button with any feedback.
Audience growth
Ratings growth
Momentum comes from crawler snapshots for the tracked storefront. “Viral growth signal” means unusually fast recent rating gains; it is an indicator, not download data.
Price tracking
Price intelligence
- First observed Aug 27, 2026 · 1:22 PM Free
Screenshots