About this app
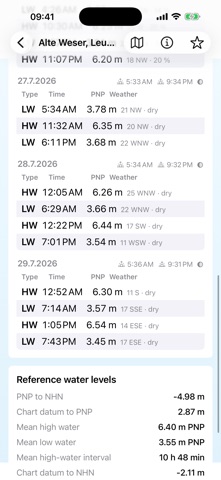
Gezeiten.app keeps upcoming high and low tides at your fingertips – clearly presented, quick to access and available directly on the map. The app provides tide forecasts for numerous gauges in Germany as well as selected stations in Norway, Belgium, Spain, Denmark and the Netherlands. All information is obtained from public data sources maintained by the responsible authorities. Features: - High and low tide forecasts for several days - Clear indication of the next tide change - Astronomical deviation between observed water levels and predicted tides, where available - Map with gauge locations - Sorting by name or distance - Search by gauge, region or country - Favourites for frequently used stations - Reference water levels and vertical datums - Sunrise, sunset and moon phase information - Weather information for forecast tide events - German, English, French, Dutch, Norwegian and Spanish - For vessels 90 metres or longer, the app also calculates the permitted maximum speeds over ground on the tidal Elbe. The calculation is based on the official current data table published by the Federal Waterways and Shipping Administration and the high-water times at the four reference gauges. Whether you are visiting the coast, travelling along the tidal Elbe, planning a trip or spending time on the water, Gezeiten.app presents the most important tide information in a clear and convenient format. The information shown is provided for general guidance. Official notices, traffic signs, instructions from vessel traffic services and nautical publications must always be followed for navigation and safety-related decisions.
Latest release
What’s New
The tide display has been expanded: • For the K13A platform, the Euro platform and Goeree Lighthouse, you can choose between MSL and ALAT. • German North Sea tide gauges support switching between tide gauge zero (PNP) and nautical chart zero (SKN) at suitable stations. • Forecast times can be displayed either in the station’s local time or in UTC. • The order of favourites is now reliably maintained even if individual stations temporarily do not provide forecast data.
Audience growth
Ratings growth
Baseline captured. Growth appears after the crawler observes a changed rating count.
Momentum comes from crawler snapshots for the tracked storefront. “Viral growth signal” means unusually fast recent rating gains; it is an indicator, not download data.
Price tracking
Price intelligence
First snapshot captured. The trend line starts after the next crawler price observation.
- First observed Sep 10, 2026 · 6:48 PM Free
Screenshots